Degradation Detection
Process
Using time histories of Geometry Data to investigate
Unwanted Track Changes and Trends
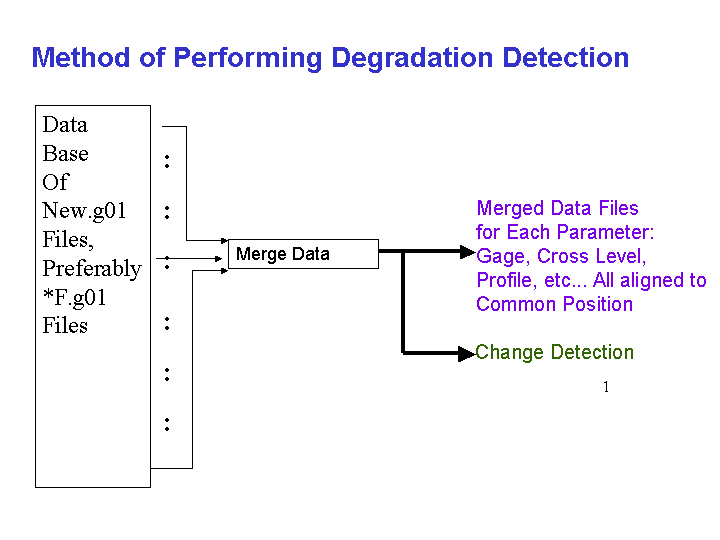
First the data base of New.g01 files has to be merged,
If we use *F.g01 files, process can be very simple
An Excerpt of the Merged file is shown Below:
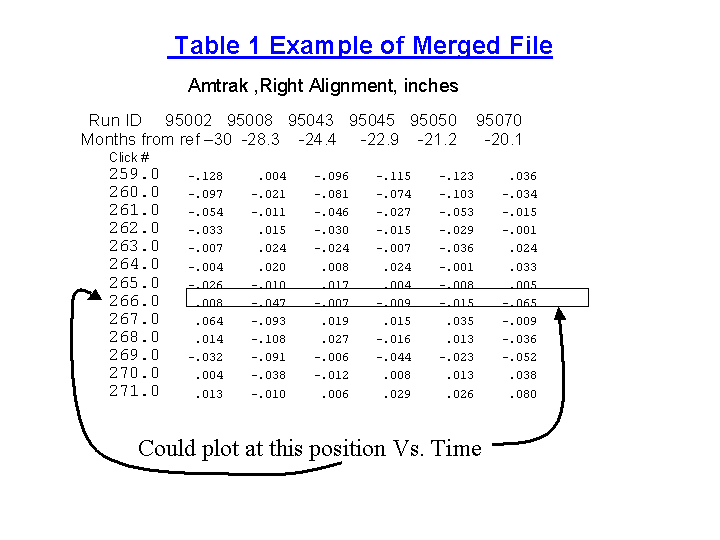
Such Files Can be generated for each parameter to be investigated.
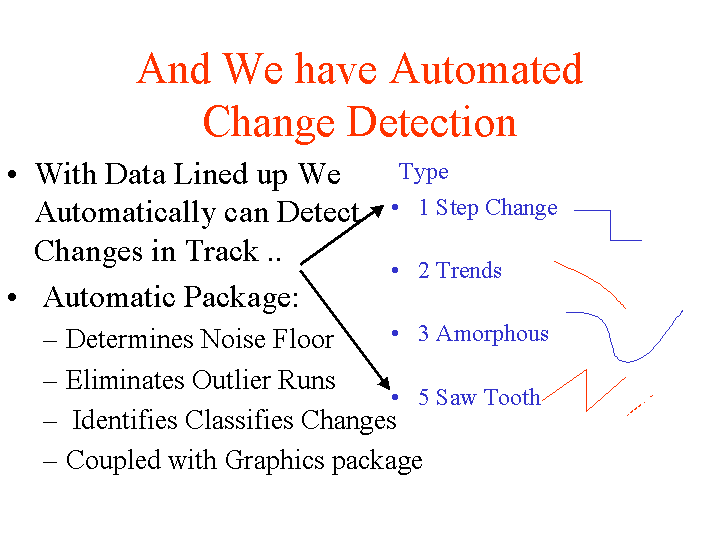
The algorithm we use takes 200 ft of data at a time,
and performs change analysis in that data block.
Then it moves to the next 200 ft.
.
...
MORE DETAIL
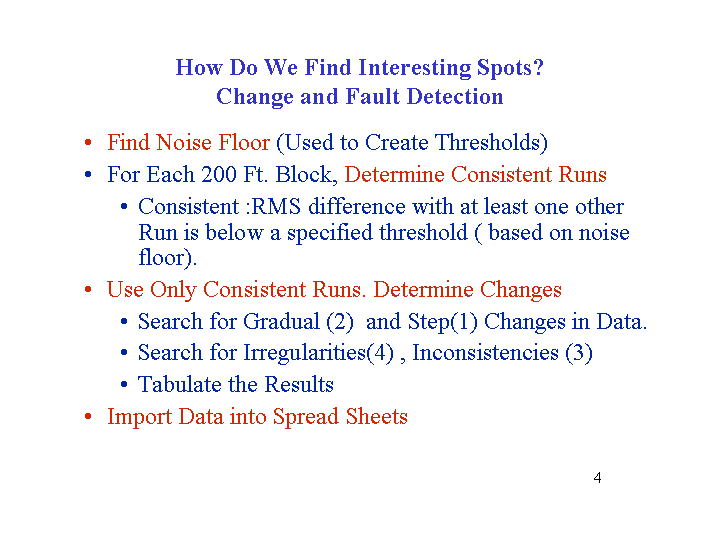
Every several ft, in the 200 ft block, time histories are
processed to detect the the changes.
A detection is accompanied by a "weight" , a measure of
goodness of fit of that observed
for the type of change being evaluated. The type of action
(1-4) with the
highest weight in the 200 ft. block is reported,
so long as this weight is greater than a threshold. Also note
that saw tooth, if it has a
weight greater than
a threshold, is also Reported. The weight is : " (measure
of the magnitude change)
/(Standard deviation of the fit to the Data)".
The Higher the weight the more obvious is the type of action.
An example of a spread sheet with the reported changes is shown next.
In this case there are 24 runs over about 5 years that are used.
...
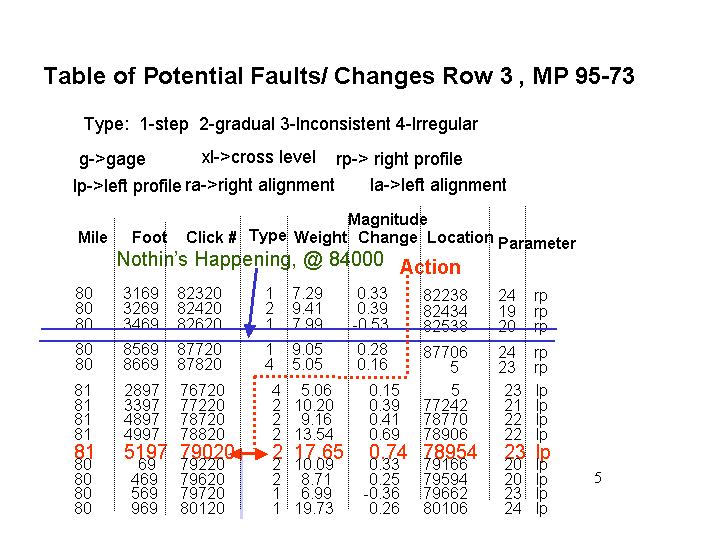
Note that the column marked "Location" is the click or ft number of the
beginning of the action
The Column "Click Number" is the first ft. number in the 200 ft
interval analyzed. The Column between
"location" and "Parameter" is the number of runs that are consistent in
the 200 ft. interval. In some versions
of the software, runs eliminated are explicitly spelled out.
Next are plots for the location highlighted in "red" in the spread sheet above. It is a Trend downward.
......
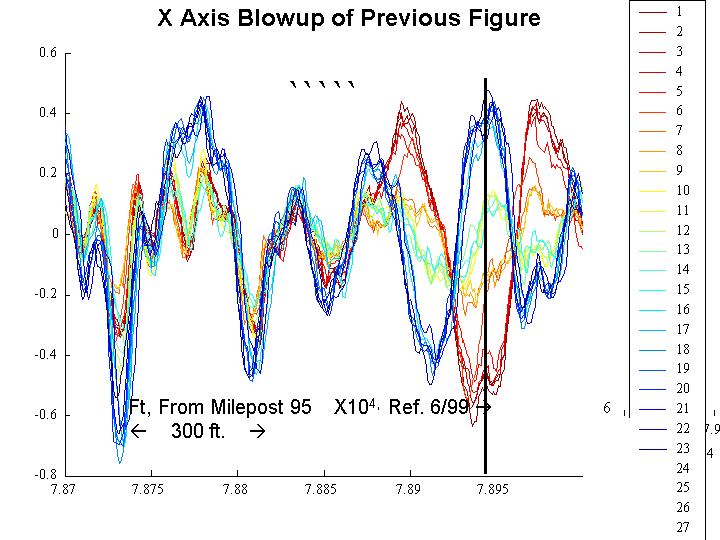
Color coding is : According to rainbow , Dark red the latest run, Dark
Blue the earliest run
In Marked location, Left profile went for +.4 inches to -.6 Inches
monotonically over 5 years
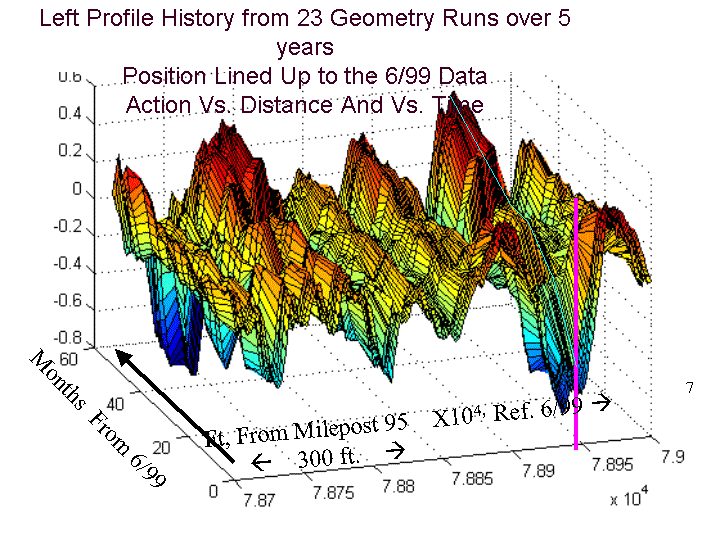
Next this same data is plotted in 3-D (Magnitude vs.distance,vs. time).
It certainly looks impressive.
..
Next we pick another location and look at gage ( with mean subtracted)
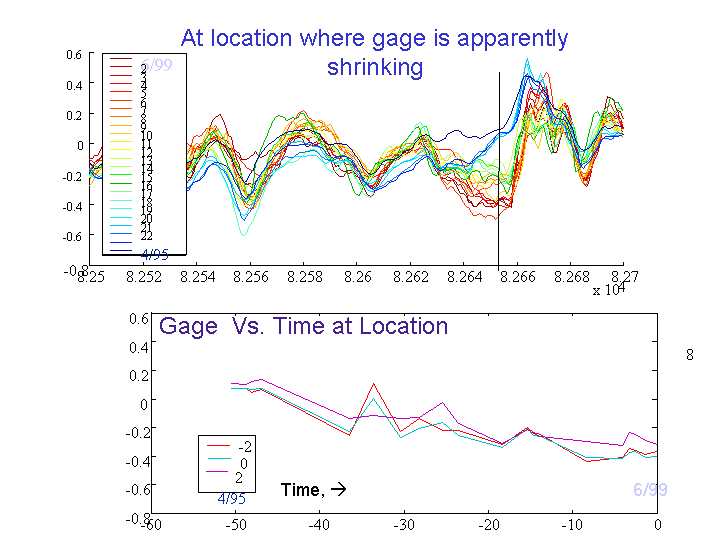
The Above descriptions should give you a feel for the type of
analysis which can be done in scanning large data bases.
All processes have been coded.


